
TTFT 排查手册:首字延迟拆解、观测与优化
TTFT 排查手册
1. TTFT 是什么
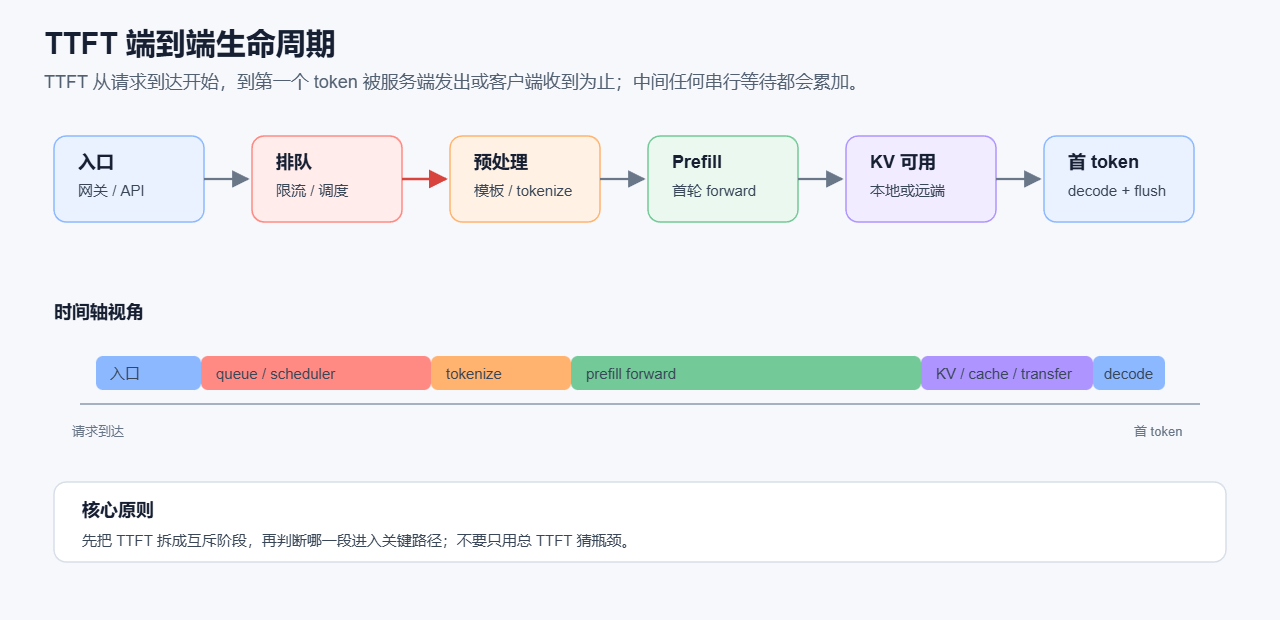
TTFT 是 Time To First Token,表示从请求进入系统,到第一个 token 可被用户观察到之间的时间。
常见有两种口径:
server_side_ttft = first_token_sent_by_server - request_received_by_server
client_side_ttft = first_token_received_by_client - request_sent_by_client
二者不同:
| 口径 | 包含内容 | 用途 |
|---|---|---|
| 服务端 TTFT | 服务端排队、预处理、prefill、KV 准备、首 token decode、flush | 定位推理服务内部瓶颈 |
| 客户端 TTFT | 客户端网络、代理、TLS、服务端 TTFT、流式缓冲、客户端读取 | 衡量用户真实感知 |
| 排查系统瓶颈时,应该优先使用服务端 TTFT;排查用户体验时,两者都要看。 | ||
 |
2. TTFT 的通用分解
最粗粒度的公式:
TTFT =
  ingress_duration
+ queue_duration
+ preprocessing_duration
+ prefill_duration
+ kv_ready_duration
+ first_decode_duration
+ stream_flush_duration
进一步展开:
TTFT =
  network_ingress
+ authentication_or_routing
+ queue_wait
+ scheduling_wait
+ prompt_template_render
+ tokenization
+ cache_lookup
+ prefill_forward
+ kv_allocation
+ kv_write_or_transfer
+ metadata_publish
+ decode_side_kv_observe
+ first_token_decode
+ stream_flush
这说明一个关键点:
TTFT 不是单纯的 prefill 时间。
🥇
prefill 通常是长 prompt 冷请求的主成本,但 P99/P999 级别的异常 TTFT 经常来自排队、KV ready、缓存后端、通信、metadata、重试或超时。
3. 更精确的关键路径模型
在现代推理系统里,很多阶段可能 overlap。例如:
- prefill forward 和 KV 写入可以 overlap。
- chunked prefill 的前一个 chunk KV 传输,可以和后一个 chunk forward overlap。
- 多个 rank、worker、shard 并行执行,TTFT 取最慢分支。
- metadata 发布和 decode 侧观察可能形成额外等待。
因此,不应总是写成:
TTFT = queue + forward + kv_transfer + decode
更通用的写法是:
TTFT =
  bootstrap_duration
+ queue_duration
+ max_i(prefill_critical_path_i)
+ first_decode_duration
+ stream_flush_duration
其中:
prefill_critical_path_i =
  kv_ready_seen_by_decode_i - prefill_start_i
i 表示影响首 token 的并行分支,例如 worker、rank、shard、chunk、KV page group、远端节点等。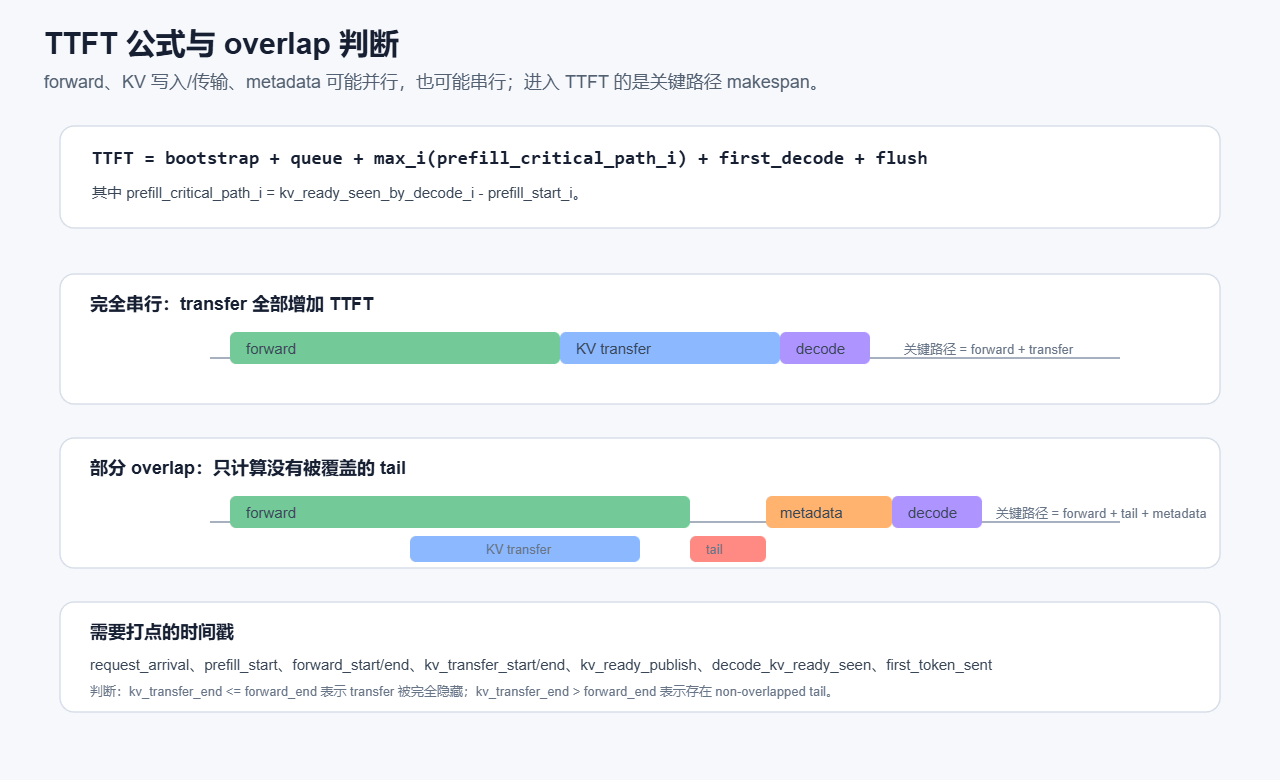
3.1 transfer duration 不一定全进 TTFT
如果 KV transfer 和 forward 完全串行:
critical_path = forward_duration + kv_transfer_duration
如果 KV transfer 被 forward 覆盖:
critical_path ≈ forward_duration
如果只有尾部没有被覆盖:
critical_path ≈ forward_duration + non_overlapped_transfer_tail
其中:
non_overlapped_transfer_tail =
  max(0, kv_transfer_end - forward_end)
所以,日志里看到 kv_transfer_duration 很大,不代表它一定导致 TTFT 大;要看它是否落在关键路径上。
3.2 必要时间戳
要判断 overlap,需要至少记录:
request_received
queue_enter
queue_exit
prefill_start
forward_start
forward_end
kv_transfer_submit
kv_transfer_start
kv_transfer_end
kv_ready_publish
decode_kv_ready_seen
first_decode_start
first_token_generated
first_token_sent
first_token_received_by_client
只记录阶段 duration 往往不够,因为无法判断阶段之间是串行还是并行。
4. 先看分布,而不是平均值
TTFT 问题有两类:
- 整体慢:P50、P90、P99 都高。
- 尾部慢:P50 正常,P99/P999 爆炸。
这两类问题的排查方向完全不同。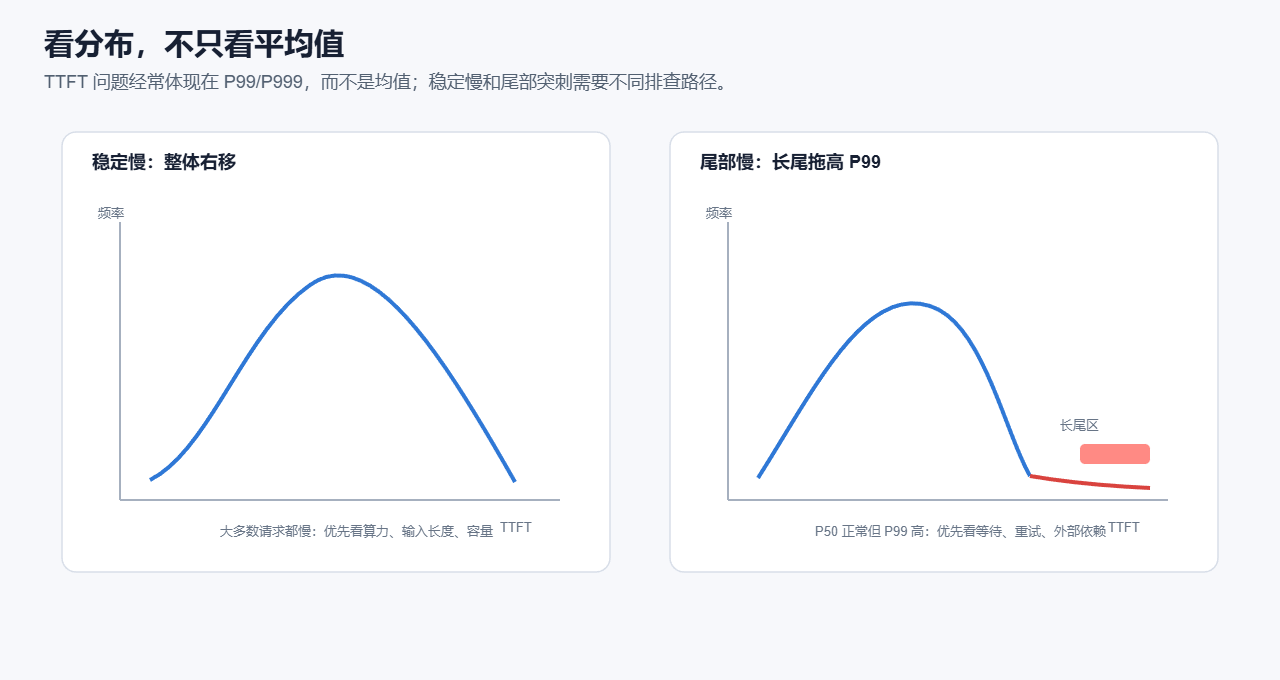
| 分布形态 | 典型原因 | 优先排查 |
|-|-|-|
| 整体右移 | 算力不足、prompt 太长、kernel 慢、tokenize 慢 | 模型执行、输入长度、硬件利用率 |
| 长尾突出 | 排队、重试、超时、KV 传输、metadata、外部依赖 | 队列、KV ready、缓存、通信、异常恢复 |
| 多峰分布 | 请求类型混杂、不同模型路径、不同节点性能 | 按 prompt 长度、缓存命中、节点分组 |
| 周期性抖动 | 批处理周期、GC、后台任务、缓存清理 | 时间维度关联系统事件 |
| 接近固定倍数 | timeout、retry、watchdog、等待阈值 | 搜索 wait/timeout/retry 日志 |
不要只看平均 TTFT。平均值会掩盖尾部请求。
5. TTFT 过高的通用原因地图
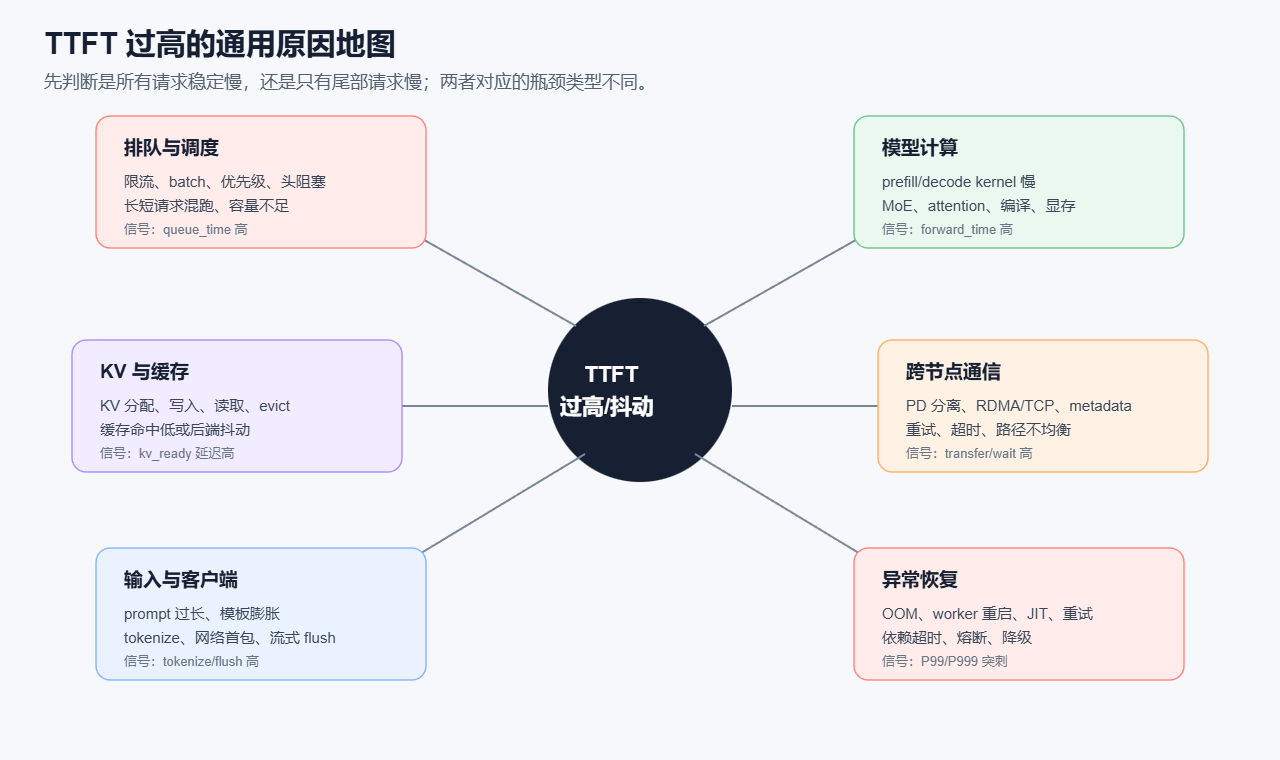
5.1 排队与调度
典型原因:
| 原因 | 说明 |
|---|---|
| 并发过高 | 请求进入系统但无法及时执行 |
| 长短请求混跑 | 长 prompt 占用 prefill 资源,短请求被拖住 |
| batch 策略不公平 | 某些请求持续等待被调度 |
| admission control 缺失 | 系统过载时仍接收请求,TTFT 变成排队时间 |
| 资源池不隔离 | 大请求、小请求、不同 SLA 请求互相影响 |
| 观测信号: |
queue_duration 高
waiting_requests 高
inflight_tokens 高
P50 正常但 P99 随并发上升快速变差
GPU 利用率可能不稳定
5.2 预处理与 tokenize
典型原因:
| 原因 | 说明 |
|---|---|
| prompt 模板膨胀 | 工具、历史消息、系统提示词导致 token 数远超预期 |
| tokenizer worker 不足 | CPU 或线程池成为瓶颈 |
| JSON/schema/tool parsing 慢 | 请求进入模型前耗时增加 |
| 输入异常 | 超长字符串、重复内容、编码异常 |
| 观测信号: |
preprocessing_duration 高
tokenization_duration 高
prompt_chars 与 prompt_tokens 比例异常
CPU 利用率高
5.3 Prefill 计算
prefill 是自回归模型处理 prompt 的首轮 forward。对长 prompt 冷请求,prefill 往往是 TTFT 的主成本。
估算:
prefill_duration ≈ prompt_tokens / prefill_tokens_per_second
典型原因:
| 原因 | 说明 |
|---|---|
| prompt 太长 | prefill 随输入长度增长 |
| attention kernel 慢 | 长上下文下尤其明显 |
| MoE / expert dispatch 慢 | MoE 模型会引入额外通信和调度 |
| JIT/编译 | 新 shape 或冷启动触发编译 |
| 显存压力 | KV cache、临时 buffer、碎片导致分配等待 |
| CPU/GPU offload | 引入 PCIe、NUMA、CPU 内存带宽瓶颈 |
| 观测信号: |
prefill_forward_duration 高
prefill_tokens_per_second 低
GPU compute utilization 高
queue_duration 不高
kv_ready_duration 不高
5.4 KV cache 与 KV ready
首 token decode 需要 KV 准备好。KV ready 可能包括:
KV allocation
KV write
KV transfer
KV metadata publish
decode side observe
cache lookup/prefetch
典型原因:
| 原因 | 说明 |
|---|---|
| cache miss | 无法复用历史 KV,需要完整 prefill |
| cache lookup 慢 | metadata 或索引查询延迟高 |
| cache write 慢 | 写路径进入首 token 关键路径 |
| KV transfer 慢 | 跨进程、跨卡、跨节点传输 |
| metadata 发布慢 | decode 侧不知道 KV 已 ready |
| eviction 抖动 | KV 被回收或迁移 |
| 观测信号: |
forward 已完成,但 first decode 没开始
kv_ready_seen_by_decode 延迟高
cache hit ratio 低
metadata latency 高
transfer tail 高
5.5 跨节点通信与外部依赖
PD 分离、多机推理、远端 KV、外部缓存、metadata 服务都会引入外部依赖。
典型原因:
| 原因 | 说明 |
|---|---|
| 网络抖动 | RDMA/TCP/IB/Ethernet 都可能有尾延迟 |
| 路径不均衡 | 某些节点、网卡、交换机路径慢 |
| metadata 服务抖动 | KV ready 依赖 metadata 可见性 |
| 重试和 timeout | 请求不失败但长时间等待 |
| 连接池耗尽 | RPC、metadata store、HTTP/gRPC 等等待连接 |
| 观测信号: |
transfer_duration 或 transfer_tail 高
metadata_operation_duration 高
retry_count 增加
timeout 接近固定时间倍数
某些节点组合 P99 特别高
5.6 Decode 与流式 flush
首 token decode 通常比 prefill 短,但仍可能成为 TTFT 的一部分。
典型原因:
| 原因 | 说明 |
|---|---|
| decode batch 等待 | 首 token decode 被batch策略延迟 |
| speculative / draft 同步 | 推测解码路径引入额外等待 |
| 流式缓冲 | token 已生成但未及时 flush |
| 代理缓冲 | API gateway、HTTP proxy、SDK 缓冲 |
| 客户端读取慢 | client 侧事件循环或网络 |
| 观测信号: |
first_token_generated 到 first_token_sent 有间隔
server TTFT 正常但 client TTFT 高
首 token 生成后没有立即 flush
5.7 异常恢复、重试和冷启动
很多极端 TTFT 来自异常路径,而不是正常计算路径。
典型原因:
| 原因 | 说明 |
|---|---|
| timeout 后重试 | 一个请求可能经历多轮等待 |
| worker 重启 | 请求迁移或重新调度 |
| OOM recovery | 内存不足后触发清理或失败重试 |
| JIT compile | 冷启动或新 shape 编译 |
| 后端依赖熔断 | 请求等待 fallback |
| 观测信号: |
P50 正常,max 极高
TTFT 接近 timeout 的整数倍
日志出现 retry / timeout / restart / compile / OOM
6. 可观测性:必须采集什么
如果只能做一件事,就先把 request_id 串起来。没有 request trace,就无法定位 TTFT。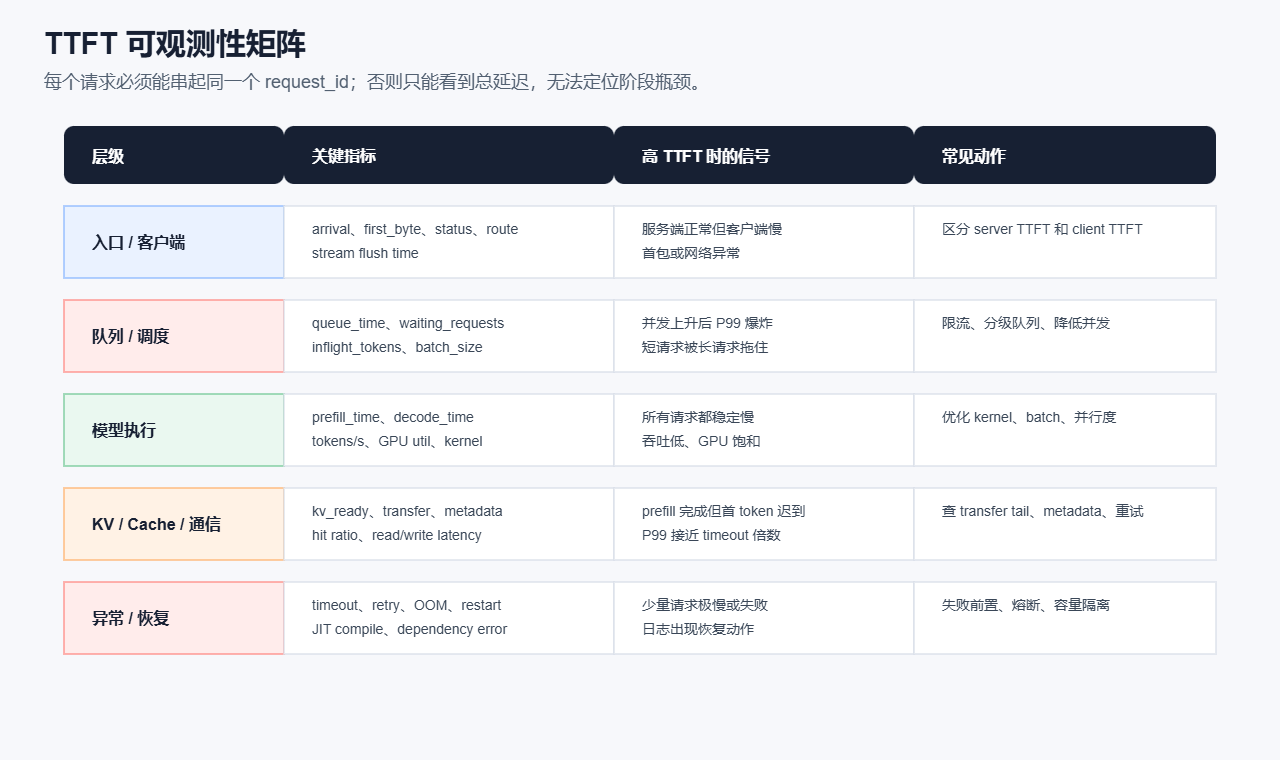
6.1 每个请求必须记录的字段
request_id
model_name
route
arrival_time
first_token_sent_time
first_token_received_time_if_available
prompt_chars
prompt_tokens
generated_tokens_at_first_flush
cache_hit_tokens
cache_miss_tokens
worker_id
node_id
gpu_id_or_device_id
error_code
retry_count
timeout_count
6.2 阶段耗时
ingress_duration
queue_duration
scheduling_duration
preprocessing_duration
tokenization_duration
cache_lookup_duration
prefill_forward_duration
kv_allocation_duration
kv_write_duration
kv_transfer_duration
metadata_publish_duration
decode_kv_observe_duration
first_decode_duration
stream_flush_duration
6.3 关键时间戳
只记录 duration 不够,建议记录时间戳:
request_received_ts
queue_enter_ts
queue_exit_ts
prefill_start_ts
forward_start_ts
forward_end_ts
kv_transfer_start_ts
kv_transfer_end_ts
kv_ready_publish_ts
decode_kv_ready_seen_ts
first_decode_start_ts
first_token_generated_ts
first_token_sent_ts
有了时间戳,才能判断:
哪些阶段 overlap
哪些阶段串行
哪个并行分支是 max
是否存在空洞期
是否有 timeout/retry 倍数
6.4 系统层指标
CPU utilization
GPU utilization
GPU memory usage
GPU memory allocation failures
network throughput
network retransmit/retry
cache backend latency
metadata backend latency
disk or object storage latency
worker restart count
OOM count
JIT compile count
7. 通用排查流程
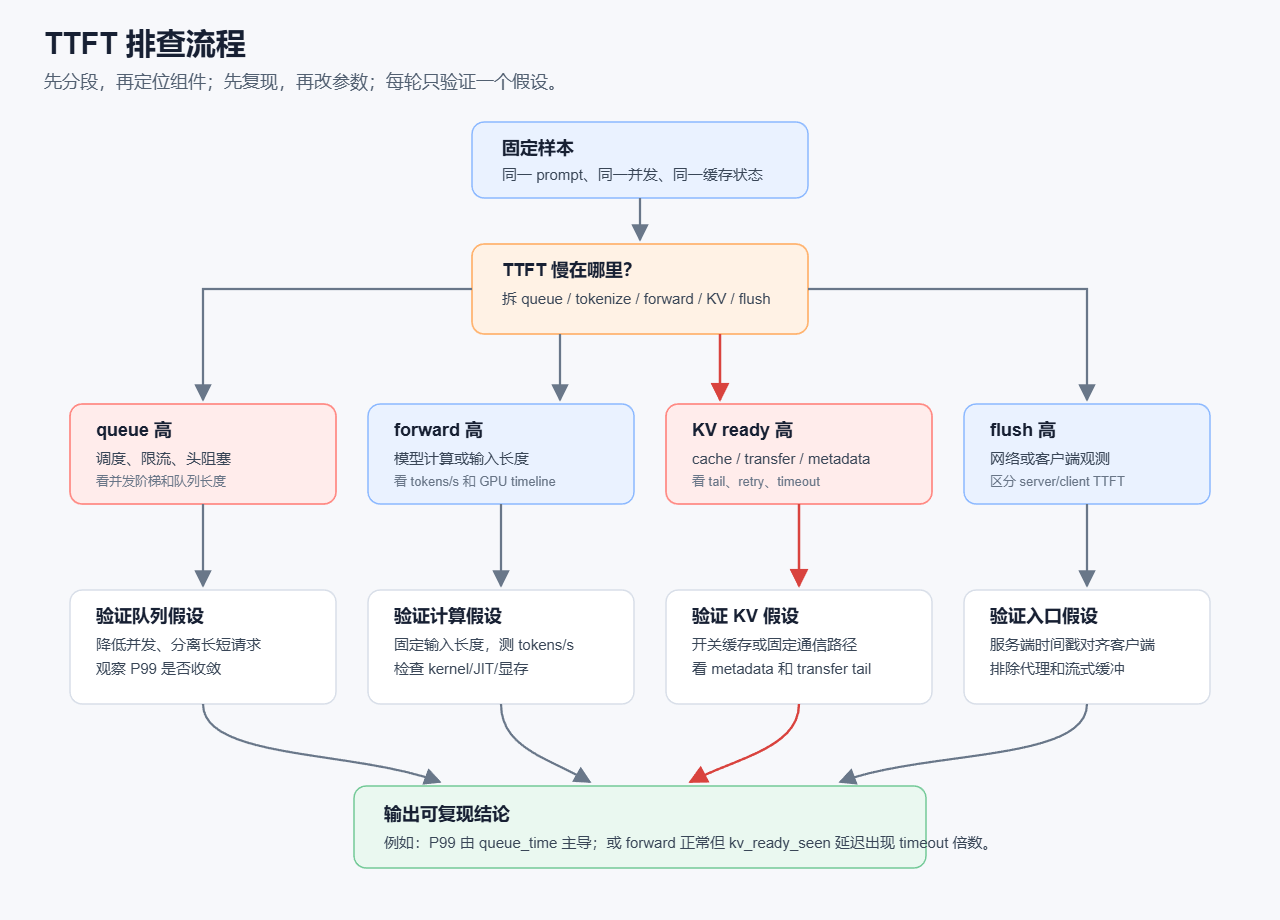
Step 1:固定样本
不要一开始就看混合线上流量。先准备可复现样本:
短 prompt
中等 prompt
长 prompt
冷缓存
热缓存
单并发
多并发
短输出
每组样本至少记录:
P50 / P95 / P99 / max TTFT
queue_duration
tokenization_duration
prefill_forward_duration
kv_ready_duration
first_decode_duration
stream_flush_duration
error_rate
timeout_rate
Step 2:判断慢在哪一段
优先回答:
TTFT 高,是 queue 高、forward 高、KV ready 高,还是 flush 高?
示例:
| request_id | TTFT | queue | tokenize | forward | kv_ready | first_decode | flush |
|---|---|---|---|---|---|---|---|
| req-1 | 2.4s | 0.1s | 0.1s | 1.9s | 0.2s | 0.05s | 0.05s |
| req-2 | 45s | 38s | 0.1s | 5s | 1s | 0.05s | 0.05s |
| req-3 | 90s | 0.2s | 0.1s | 8s | 81s | 0.05s | 0.05s |
| 解读: | |||||||
| 主导阶段 | 优先方向 | ||||||
| - | - | ||||||
| queue | 调度、并发、容量、admission control | ||||||
| tokenize | 输入模板、tokenizer worker、CPU | ||||||
| forward | 模型计算、kernel、并行度、显存 | ||||||
| kv_ready | KV cache、通信、metadata、重试 | ||||||
| flush | 服务端流式、代理、客户端网络 |
Step 3:判断是稳定慢还是尾部慢
P50 高:先看计算、输入、容量
P99 高:先看排队、KV ready、外部依赖、异常恢复
Step 4:按请求维度分组
至少按这些维度切:
prompt_tokens bucket
cache_hit_ratio bucket
concurrency level
route or tenant
worker/node
model version
cold start vs warm
success vs retry
很多 TTFT 问题只在某个分组里出现。
Step 5:还原慢请求时间线
对 P99/P999 请求,逐条还原:
00.000 request_received
00.005 queue_enter
12.300 queue_exit
12.330 tokenize_done
12.340 prefill_start
18.900 forward_end
19.100 kv_transfer_start
79.100 kv_transfer_timeout
79.300 retry
139.300 second_timeout
139.500 first_token_sent
这种时间线比任何总表都更有用。
8. A/B 实验矩阵
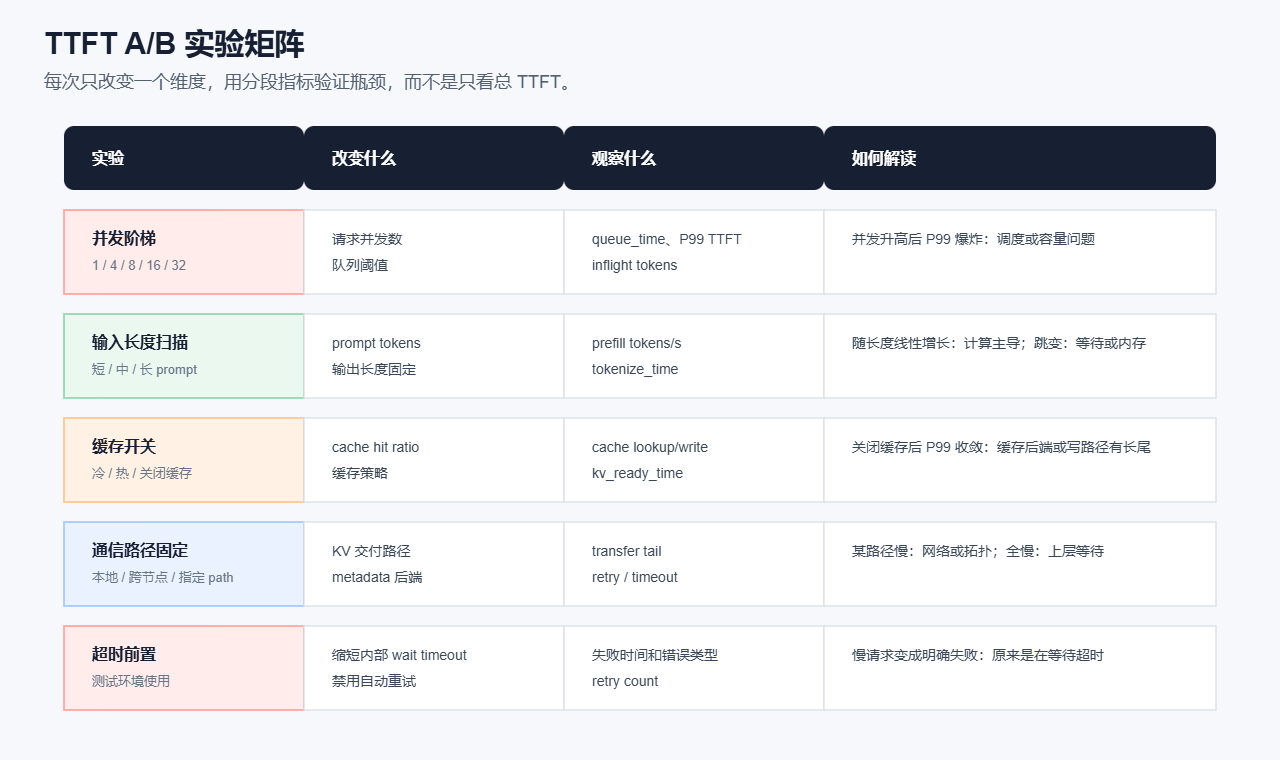
8.1 并发阶梯
目的:验证排队和容量。
做法:
固定 prompt
固定输出长度
固定缓存状态
并发从 1、2、4、8、16 逐步增加
观察:
queue_duration
prefill_forward_duration
kv_ready_duration
P99 TTFT
GPU utilization
inflight tokens
解读:
| 现象 | 结论 |
|---|---|
| 并发升高后 queue 快速上升 | 容量或调度瓶颈 |
| forward 也变慢 | 计算资源竞争 |
| kv_ready 变慢 | KV/cache/通信瓶颈 |
| P50 稳定但 P99 爆炸 | 长尾等待或少数路径异常 |
8.2 输入长度扫描
目的:区分计算主导和等待主导。
做法:
固定并发
固定输出长度
测试不同 prompt_tokens
如果 TTFT 随 prompt_tokens 近似线性增长,多半是 prefill 计算主导。
如果某些长度出现跳变,可能是:
chunk 边界
显存阈值
KV page 阈值
缓存策略阈值
通信分片阈值
batch 策略变化
8.3 冷热缓存对照
目的:判断 cache 是否有效,或 cache 后端是否带来长尾。
对照:
冷缓存
热缓存
关闭缓存
不同 cache write/read 策略
解读:
| 现象 | 结论 |
|---|---|
| 热缓存显著降低 TTFT | cache hit 有效 |
| 低命中比关闭缓存还慢 | cache lookup/write 或 metadata 进入关键路径 |
| cache P99 高但 P50 正常 | cache backend 长尾 |
8.4 通信路径固定
目的:定位跨节点或远端 KV 问题。
做法:
本地 KV vs 远端 KV
固定 source/destination worker
固定网络路径或设备
逐节点组合测试
解读:
| 现象 | 结论 |
|---|---|
| 某些节点组合慢 | 网络、拓扑、设备或负载不均 |
| 本地正常、远端慢 | 通信或 metadata 问题 |
| 所有路径都慢 | 上层等待或资源不足 |
8.5 超时前置
目的:判断极端 TTFT 是否来自等待超时。
只建议测试环境使用。
做法:
缩短内部等待 timeout
减少 retry 次数
关闭自动 fallback
如果慢请求变成更早失败,说明原来是在等待 timeout,而不是正常计算慢。
9. 常见现象与判断
9.1 P50 正常,P99 很高
高概率原因:
排队头阻塞
外部依赖 P99 高
KV transfer 或 metadata 长尾
少数节点异常
重试或 timeout
优先动作:
按 node/worker 分组
查 retry/timeout
查 queue_time
查 kv_ready_time
查外部依赖 P99
9.2 所有请求都慢
高概率原因:
模型计算慢
输入太长
tokenizer 慢
容量不足
硬件降频或资源争用
优先动作:
测 prefill tokens/s
测 decode tokens/s
检查 GPU/CPU 利用率
固定输入长度做基准
9.3 TTFT 接近固定时间倍数
例如:
30s
60s
120s
300s
600s
高概率原因:
timeout
retry
watchdog
连接池等待
metadata 等待
远端 KV 等待
优先搜索日志:
timeout
wait
waiting
retry
fallback
watchdog
metadata
transfer
kv ready
connection pool
9.4 服务端 TTFT 正常,客户端 TTFT 高
高概率原因:
代理缓冲
HTTP streaming 未 flush
SDK 等待完整 chunk
客户端网络慢
客户端事件循环阻塞
优先动作:
对齐 first_token_sent 和 first_token_received
绕过代理测试
抓包或记录 first byte
确认流式响应立即 flush
10. 优化策略
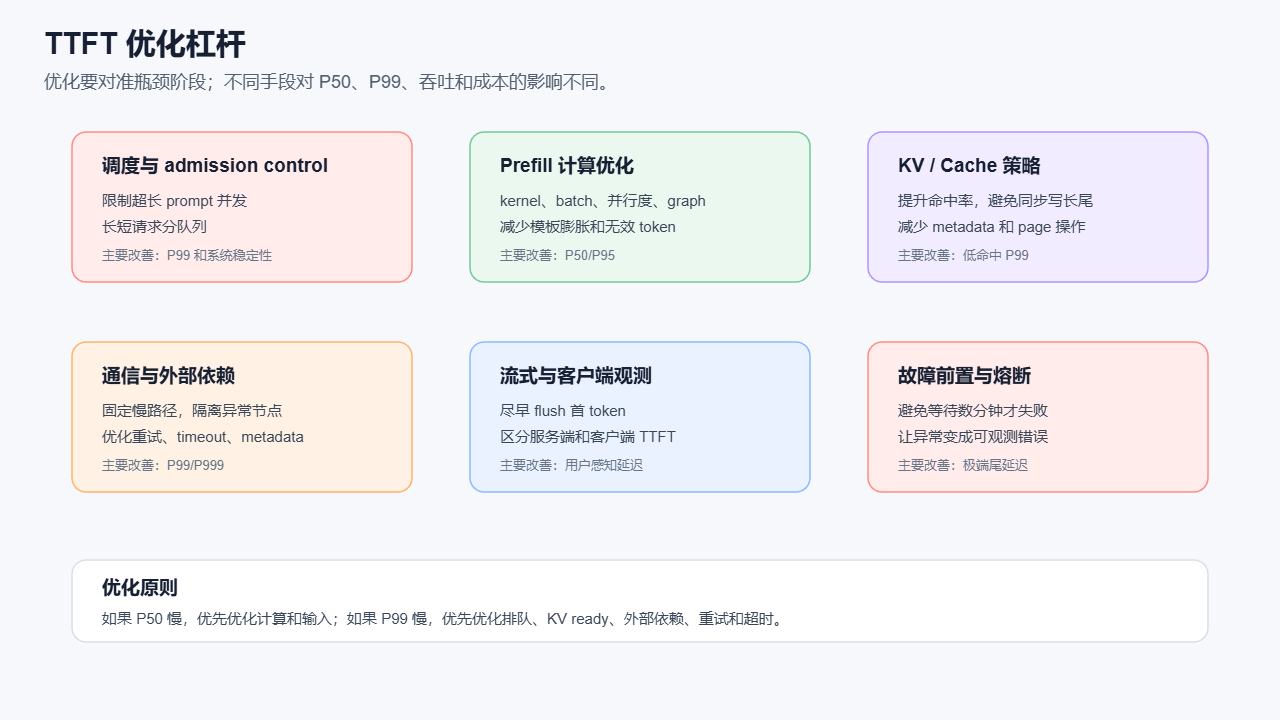
10.1 优化排队
可选手段:
admission control
按 prompt_tokens 分级队列
长短请求隔离
限制超长请求并发
基于 tokens 而不是 requests 做限流
提前拒绝而不是无限排队
适用场景:
queue_duration 高
P99 随并发升高爆炸
短请求被长请求拖住
10.2 优化 prefill
可选手段:
优化 attention kernel
选择合适 chunk size
启用兼容的 graph/overlap
减少无效 prompt tokens
优化并行度
避免频繁 JIT compile
降低内存碎片
适用场景:
prefill_forward_duration 高
tokens/s 低
P50/P95 都慢
10.3 优化 KV ready
可选手段:
提高 cache hit ratio
避免同步 cache write 阻塞首 token
减少 metadata 操作数量
优化 KV transfer overlap
定位 non-overlapped transfer tail
隔离慢节点或慢路径
适用场景:
forward 已完成但 first decode 没开始
kv_ready_seen_by_decode 延迟高
cache/metadata/transfer P99 高
10.4 优化外部依赖
可选手段:
连接池扩容
metadata 服务拆分和限流
超时前置
减少重试层数
失败快速返回
熔断慢后端
适用场景:
TTFT 接近 timeout 倍数
外部依赖 P99 高
retry_count 高
10.5 优化流式首包
可选手段:
first token 生成后立即 flush
关闭代理缓冲
减少首包前 post-processing
区分 token generated 和 token sent
SDK 使用真正 streaming 读取
适用场景:
first_token_generated 正常
first_token_sent 或 client_received 慢
11. 现场排查 Checklist
11.1 先问 8 个问题
- 这是服务端 TTFT 高,还是客户端 TTFT 高?
- P50 是否也高,还是只有 P99/P999 高?
- 高 TTFT 是否接近固定 timeout 倍数?
- 高 TTFT 请求的 prompt_tokens 是多少?
- cache hit ratio 是多少?
- queue_duration 占比多少?
- forward 是否已经结束,KV ready 是否迟迟不可见?
- 高 TTFT 是否集中在某些节点、worker、租户或请求类型?
11.2 必须拿到的 10 个字段
- request_id
- server_side_ttft
- client_side_ttft
- prompt_tokens
- cache_hit_ratio
- queue_duration
- prefill_forward_duration
- kv_ready_duration
- first_decode_duration
- retry_count / timeout_count
11.3 第一个小时的排查顺序
- 找 20 条最高 TTFT 请求
- 拆分 queue / tokenize / forward / kv_ready / flush
- 看是否接近 timeout 倍数
- 按 prompt_tokens、cache_hit_ratio、node、worker 分组
- 对一条慢请求还原完整时间线
- 做单并发基线
- 做并发阶梯
- 做缓存开关或冷热缓存对照
11.4 最容易误判的点
| 误判 | 正确做法 |
|---|---|
| TTFT 高就认为 GPU 慢 | 先看 queue、kv_ready、flush |
| kv_transfer_duration 高就认为它进了 TTFT | 看是否被 forward overlap |
| 平均值正常就认为系统健康 | 必须看 P99/P999 |
| 服务端日志正常就认为用户体验正常 | 对齐 client_side_ttft |
| 改多个参数后 P99 下降 | 每次只改一个维度,否则不知道哪个生效 |
12. 推荐的标准输出格式
每次排查结束,建议输出这样的结论,而不是只说“TTFT 很高”。
问题范围:
  P50 正常,P99 高;主要发生在长 prompt + 低 cache hit 请求。

关键证据:
  高 TTFT 请求中,prefill_forward_duration 约 8s;
  kv_ready_duration P99 达到 80s;
  多数慢请求伴随 metadata retry。

结论:
  当前 TTFT 不是 GPU prefill 主导,而是 KV ready 关键路径长尾。

下一步:
  1. 固定通信路径做 A/B;
  2. 缩短测试环境 metadata wait timeout;
  3. 对 cache write 做异步化实验;
  4. 对慢节点单独隔离压测。
13. 总结
TTFT 分析的核心不是记住某个固定公式,而是建立一个可观测的关键路径模型:
TTFT =
  bootstrap
+ queue
+ max(prefill / KV ready critical path)
+ first decode
+ flush
排查时按下面顺序推进:
- 先区分服务端 TTFT 和客户端 TTFT。
- 再看分布:P50 慢还是 P99 慢。
- 然后拆阶段:queue、tokenize、forward、KV ready、flush。
- 对 P99 请求还原时间线。
- 用 A/B 实验验证唯一假设。
- 最后才改参数或做架构优化。
🥇
一句话原则:P50 慢,优先看计算和输入;P99 慢,优先看排队、KV ready、外部依赖、重试和 timeout。
阅读导航